
Case Study
Solar for a Pampanga Poultry Farm: A Worked Example
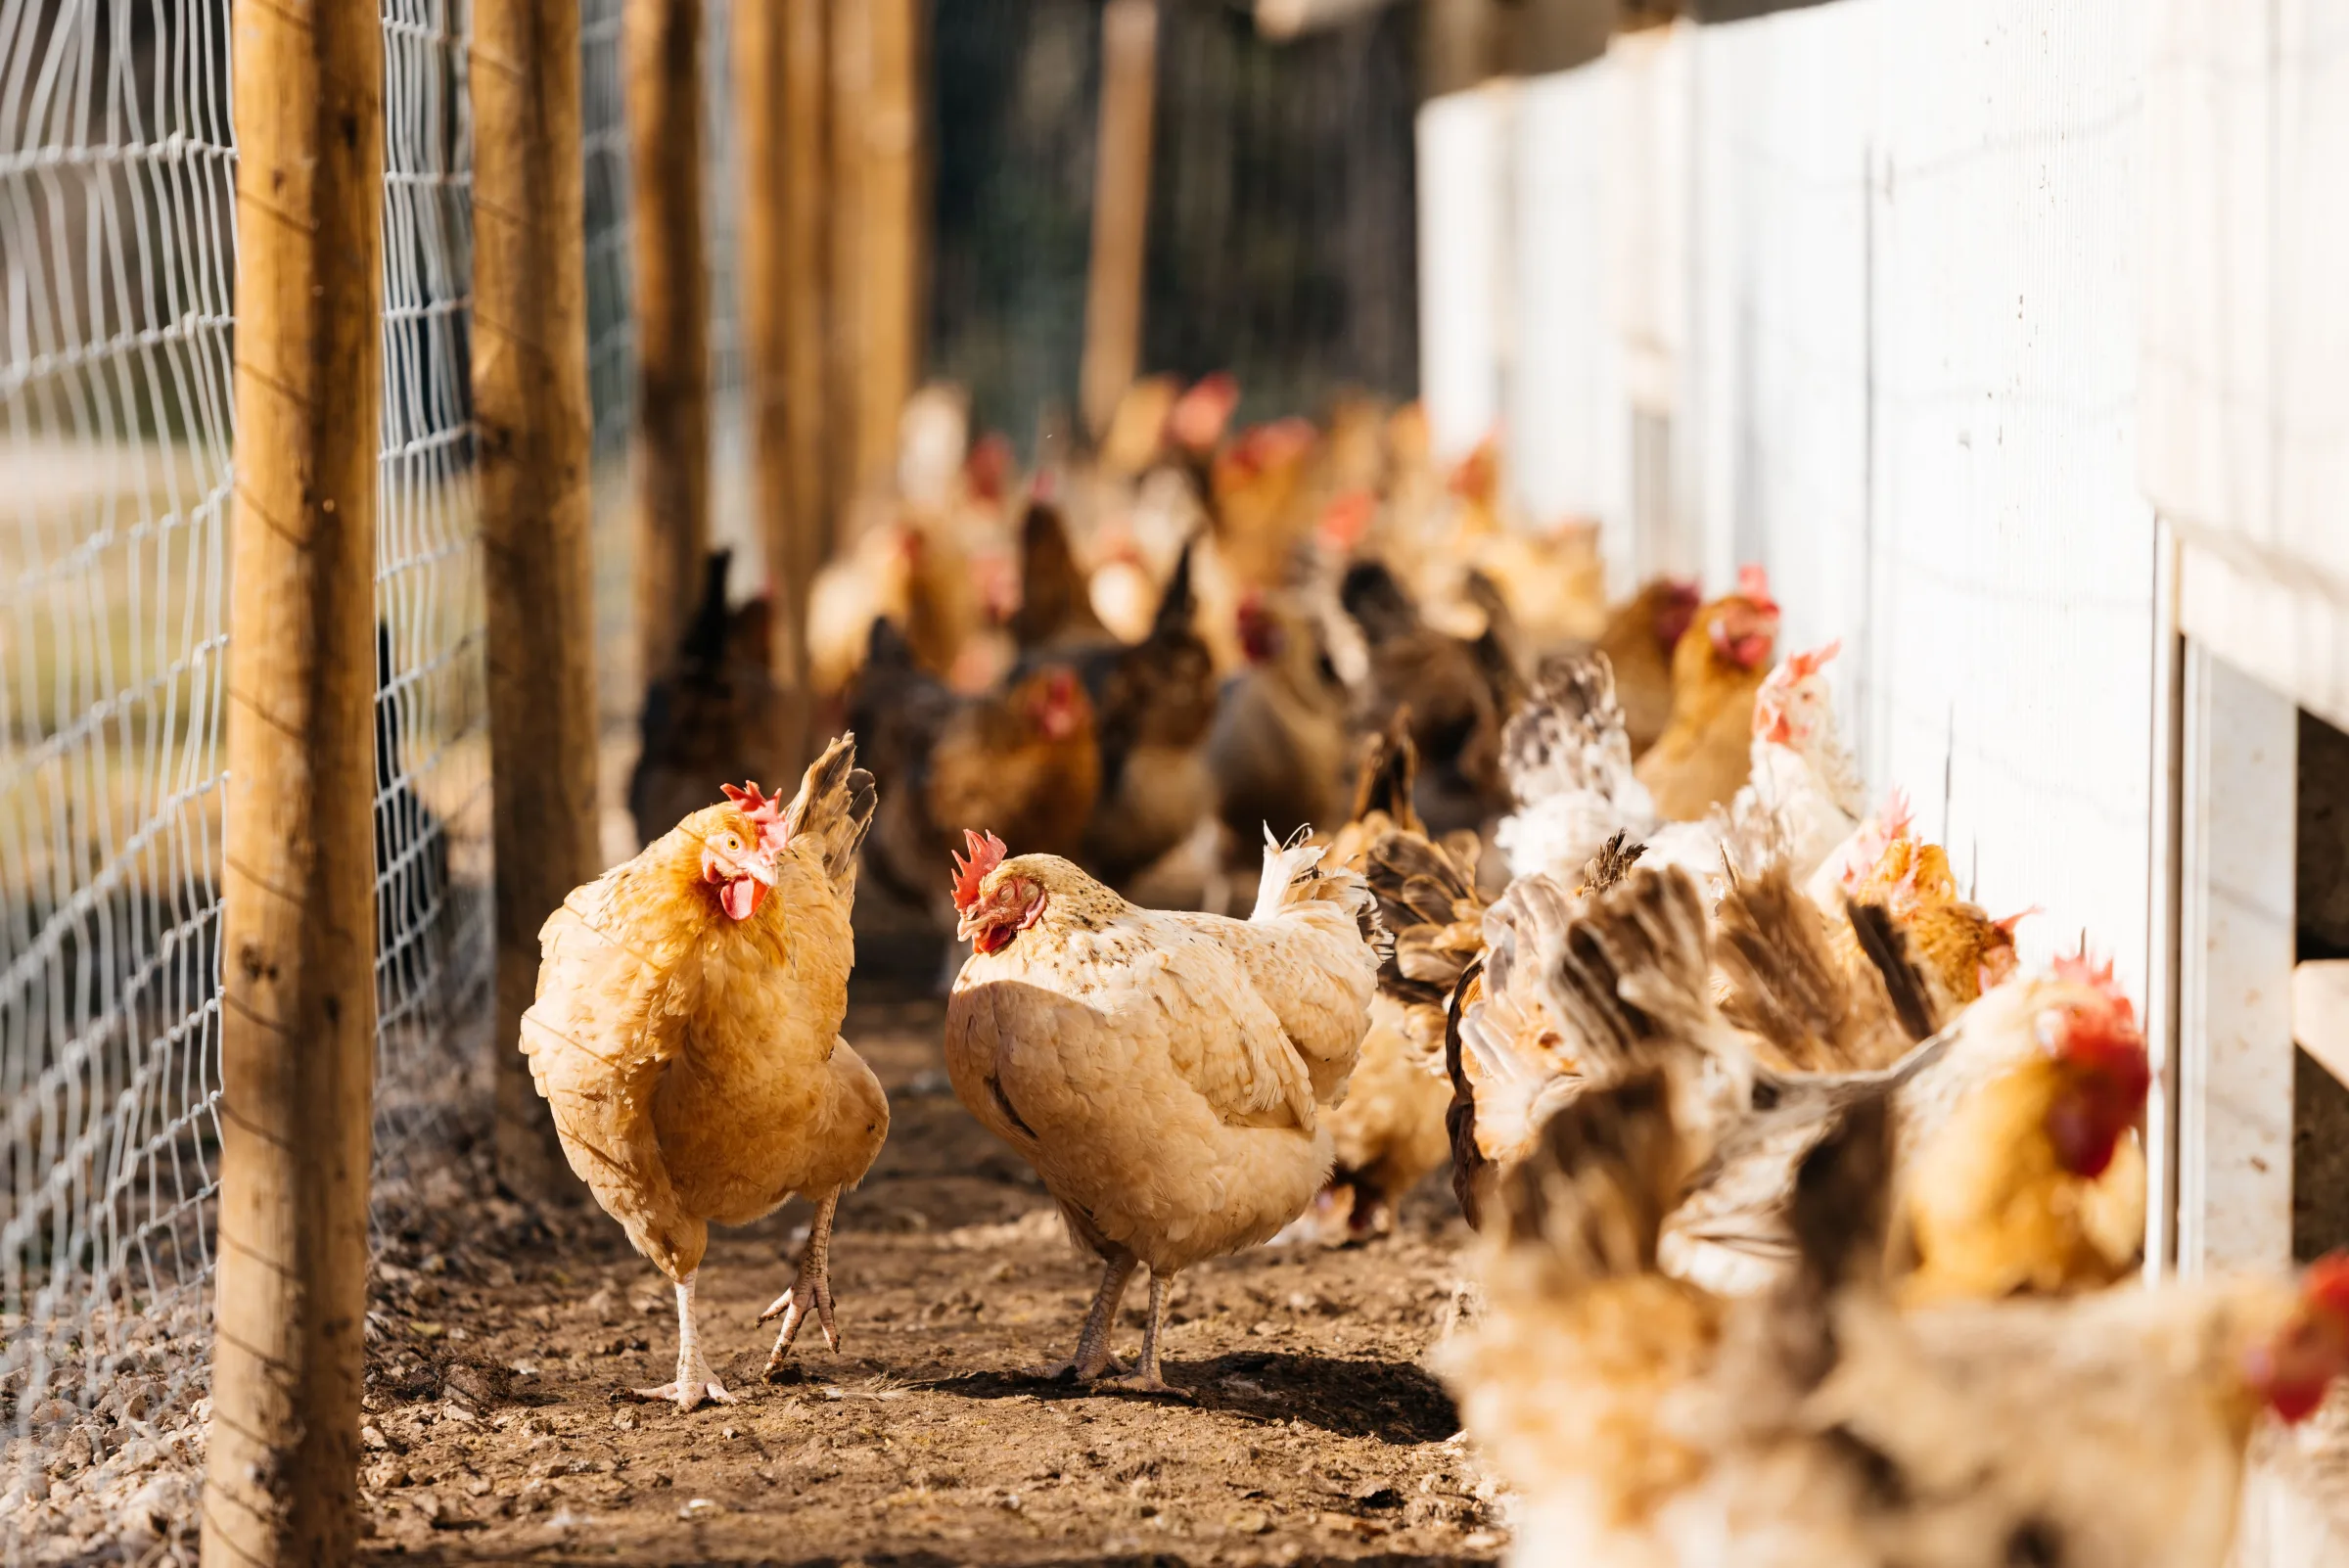
What does solar actually do for a poultry farm? We modelled a 40,000-bird tunnel-ventilated broiler operation in Pampanga from the fan schedule up — every assumption stated, every figure computed.
Location
Pampanga
System Size
30 kWp
Completed
August 2026
What this is. A complete engineering and financial model for a representative tunnel-ventilated broiler operation, built from the equipment schedule upward. Every assumption is stated so you can substitute your own figures. What this is not. A client case study. The operation modelled here is representative, not a specific farm. Where we publish client results, they are labelled as such and the client has approved the figures.
Quick Answer
The modelled operation: two tunnel-ventilated broiler houses, 20,000 birds each, six growout cycles a year. Annual consumption: 58,000 kWh — roughly 4,833 kWh a month, built up from the actual fan, pump, feeder and lighting schedule rather than estimated. System specified: 30 kWp, sized to match daytime consumption rather than total consumption. Result: 68% of annual consumption generated, 58% consumed directly on site, and a 63% reduction in the monthly bill at an assumed ₱12.00/kWh. Payback: 3.1 to 5.1 years depending on installed cost, at ₱45,000–₱75,000 per kWp. The reason poultry works so well: ventilation load rises with temperature, so the farm draws hardest at exactly the hours the array produces most. Very few commercial loads match this closely.
Why poultry is the strongest agricultural case for solar
The load profile is almost perfectly matched
Poultry houses draw their heaviest load precisely when the sun is strongest. Ventilation demand scales with temperature — the hotter the afternoon, the harder the fans work, and the more the array produces.
Tunnel-ventilated houses consume substantially more than conventional ones because of the tunnel and sidewall fans, the evaporative cooling pump, the drinking-line pump and the feeder-line pump all running together. That extra consumption is almost entirely daytime and temperature-driven — which is to say, almost entirely offsettable.
Power loss is not a cost problem, it is a total loss problem
Worth stating plainly, because it changes how storage should be evaluated:
Without power to run the fans in a tunnel house during hot weather, a flock can be lost in minutes, not hours.
For a household, battery storage buys comfort. For a poultry operation it is insurance on the flock in the house — and it should be costed against the value of those birds, not against the electricity it saves. A single lost flock will typically exceed the cost of the storage that would have prevented it.
The growout cycle uses net metering efficiently
Poultry demand is not flat. Day-old chicks need heat and minimal ventilation; mature birds need maximum ventilation. Consumption therefore climbs steeply across each cycle and falls to almost nothing during cleanout.
The consequence is that during the early weeks of a cycle, and throughout the downtime between flocks, generation exceeds on-site demand — banking export credit that is then drawn down during the high-ventilation final weeks. Few load profiles use net metering this efficiently.
Stable power affects production, not just cost
Inconsistent supply has direct production consequences: in layer operations, irregular lighting affects egg output; in broilers, weak ventilation raises stress and reduces growth. The value of self-generated supply shows up in flock performance, not only the electricity bill.
Step 1 — Connected load, built from the equipment schedule
Rather than estimating, we build the load from what is actually installed in a 20,000-bird tunnel-ventilated house.
| Equipment | Rating |
|---|---|
| Tunnel fans, 8 × 1.10 kW | 8.80 kW |
| Sidewall / minimum-ventilation fans, 4 × 0.40 kW | 1.60 kW |
| Evaporative cooling pad pump | 0.75 kW |
| Drinking line pump | 0.55 kW |
| Feeder line motors, 2 × 0.75 kW | 1.50 kW |
| Lighting | 1.50 kW |
| Controls and sensors | 0.20 kW |
| Peak per house | 14.90 kW |
| Peak, two houses | 29.80 kW |
At a power factor of 0.85 that is 35.1 kVA for the site.
Cross-check. A widely cited industry figure puts a 50,000-bird tunnel-ventilated operation at around 50 kVA. Pro-rata, our 40,000 birds would be 40 kVA. Our build-up gives 35.1 kVA — slightly conservative, which is the right direction for a model.
Step 2 — Energy per growout cycle
Peak load is not average load. Ventilation demand rises with bird age, so we model the 35-day growout in three stages.
| Stage | Days | Average draw | Energy per house |
|---|---|---|---|
| Days 1–7 · brooding, minimum ventilation | 7 | 2.0 kW | 336 kWh |
| Days 8–21 · transition ventilation | 14 | 4.0 kW | 1,344 kWh |
| Days 22–35 · full tunnel ventilation | 14 | 9.0 kW | 3,024 kWh |
| Per house, per cycle | 35 | 4,704 kWh | |
| Two houses, per cycle | 9,408 kWh |
Note the shape: the final fortnight consumes 64% of the entire cycle's energy. That concentration is what makes sizing to average consumption a mistake, and it is why the credit banked earlier in the cycle matters.
Step 3 — Annual consumption
Six cycles a year, with 35 days of growout and roughly 25 days of cleanout and downtime between flocks.
| Component | Calculation | Energy |
|---|---|---|
| Growout | 9,408 kWh × 6 cycles | 56,448 kWh |
| Downtime | 5 kWh/house/day × 2 houses × 155 days | 1,550 kWh |
| Annual consumption | 57,998 kWh | |
| Monthly average | 4,833 kWh |
Step 4 — Sizing the system
Production yield in Philippine conditions: 4.5 peak sun hours × 0.80 system efficiency × 365 days = 1,314 kWh per kWp per year
The 0.80 accounts for inverter losses, high-temperature derating, wiring and soiling. Soiling matters more than usual on a poultry site — dust and feather debris both accumulate on the array.
Size to daytime consumption, not total consumption. Ventilation load is temperature-driven and concentrated in daylight hours; we model the daytime share at 58%.
| Step | Calculation | Result |
|---|---|---|
| Daytime consumption | 57,998 × 0.58 | 33,639 kWh |
| Capacity to match it | 33,639 ÷ 1,314 | 25.6 kWp |
| Specified system | rounded up to bank cycle credit | 30 kWp |
Step 5 — Production and how it is used
| Annual production | 30 kWp × 1,314 = 39,420 kWh |
| Self-consumed (85%) | 33,507 kWh |
| Exported | 5,913 kWh |
| Production as a share of consumption | 68.0% |
| Consumption met directly by solar | 57.8% |
The 85% self-consumption figure is high, and it is the point — on a load profile this well matched, most of what the array makes is used on the spot at full retail value rather than exported at the lower generation rate.
Step 6 — The financial result
Assumed rates. Retail ₱12.00/kWh, export credit ₱6.50/kWh. These must be replaced with the actual figures from your bill. Most of Pampanga is served by electric cooperatives — PELCO I, II and III — or by SFELAPCO, not Meralco, and co-op rates differ.
| Calculation | Annual | |
|---|---|---|
| Saving on self-consumption | 33,507 × ₱12.00 | ₱402,084 |
| Export credit | 5,913 × ₱6.50 | ₱38,434 |
| Total annual saving | ₱440,518 | |
| Monthly average saving | ₱36,710 |
Effect on the bill:
| Before | 4,833 kWh × ₱12.00 = ₱57,998/month |
| Grid draw after | 24,491 kWh/year = 2,041 kWh/month |
| After, net of export credit | ₱21,288/month |
| Reduction | 63% |
Step 7 — Payback
Installed cost varies with roof type, structural work, cable runs and distance to the point of connection, so we show it as a range rather than a single figure.
| Installed cost per kWp | System cost | Payback |
|---|---|---|
| ₱45,000 | ₱1,350,000 | 3.1 years |
| ₱55,000 | ₱1,650,000 | 3.7 years |
| ₱65,000 | ₱1,950,000 | 4.4 years |
| ₱75,000 | ₱2,250,000 | 5.1 years |
Sensitivity to the electricity rate (at ₱55,000/kWp installed):
| Retail rate | Annual saving | Payback |
|---|---|---|
| ₱10.00/kWh | ₱367,000 | 4.5 years |
| ₱12.00/kWh | ₱440,400 | 3.7 years |
| ₱14.00/kWh | ₱513,800 | 3.2 years |
Against a 25-year asset life, every case in this table returns the capital several times over. The rate assumption moves the payback by roughly a year in either direction — which is why the first thing we ask for is twelve months of actual bills.
What this model does not include
Stating the limits is part of making the model useful.
- Storage is not costed here. This is a grid-tied model. Given the consequences of ventilation failure, most poultry operations should evaluate storage separately — and against the value of the flock, not the electricity.
- Structural assessment. Poultry house roofs vary widely in construction and condition. Capacity for an array must be assessed, not assumed.
- The distribution utility's interconnection requirements, which differ between electric cooperatives.
- Rate escalation. Every figure above holds the electricity rate flat for 25 years, which has not happened in any recent period. Escalation improves every result.
- Production benefits. More stable power and better-maintained ventilation affect mortality, feed conversion and growth rate. Real, but not quantified here.
Applying this to your own operation
Four inputs change the answer materially:
- Bird capacity and number of houses — scales the whole model
- Tunnel-ventilated or conventional — tunnel houses consume far more, and are far better solar candidates
- Broiler or layer — layers run continuous lighting programmes and a different demand shape
- Your actual tariff — the single largest lever on payback
Send SolarSwitch twelve months of bills and your house specifications, and we will run this model on your figures rather than these. If the answer is that solar does not suit your operation, we will tell you that too.
Frequently asked questions
How much electricity does a poultry farm use in the Philippines?
For a tunnel-ventilated broiler operation, our modelled figure is approximately 4,704 kWh per house per 35-day growout cycle for a 20,000-bird house — around 58,000 kWh a year for a two-house, 40,000-bird operation running six cycles. Conventional naturally ventilated houses consume considerably less, as the tunnel fans, cooling pad pump and associated equipment are the dominant loads.
What size solar system does a poultry farm need?
It should be sized against daytime consumption rather than total consumption. For the 40,000-bird operation modelled here, 58% of consumption falls in daylight hours, giving a requirement of about 25.6 kWp, specified at 30 kWp to bank export credit during low-demand periods of the growout cycle.
Is solar worth it for a poultry farm?
The load profile is among the best-matched of any commercial application, because ventilation demand rises with temperature at the same hours the array produces most. Our model shows a 63% reduction in the monthly bill and payback between 3.1 and 5.1 years depending on installed cost, against an asset life of about 25 years.
Should a poultry farm include battery storage?
It should at least be evaluated. Loss of ventilation in a tunnel house during hot weather can kill a flock within minutes, so storage on the ventilation circuits functions as insurance on the birds rather than as an energy saving. The correct comparison is the cost of storage against the value of a flock, not against the electricity bill.
Does net metering work well for poultry operations?
Unusually well. Demand follows the growout cycle, so during brooding and the downtime between flocks the array generates more than the farm consumes, banking credit that is drawn down during the high-ventilation final weeks of each cycle. Note that most of Pampanga is served by electric cooperatives rather than Meralco, and application processes differ between distribution utilities.
Model assumptions, in one place
| Assumption | Value | Basis |
|---|---|---|
| Houses | 2 | Modelled operation |
| Birds per house | 20,000 | Modelled operation |
| Growout cycle | 35 days | Typical broiler cycle |
| Cycles per year | 6 | 35 days grow + ~25 days downtime |
| Peak sun hours | 4.5 | Philippine annual average |
| System efficiency | 0.80 | Inverter, thermal, wiring, soiling |
| Daytime consumption share | 58% | Temperature-driven ventilation load |
| Self-consumption share | 85% | Load/production matching |
| Retail rate | ₱12.00/kWh | Assumed — verify against your bill |
| Export credit rate | ₱6.50/kWh | Assumed — generation component only |
| Installed cost | ₱45,000–75,000/kWp | Shown as a range |