
Case Study
Solar for a Supermarket: A Worked Example (2026)
We modelled a 600 sqm neighbourhood supermarket from the equipment schedule up. Solar cuts the bill by 31%, not the 65% people expect — and the reason why is the most useful thing a retail owner can understand before buying.
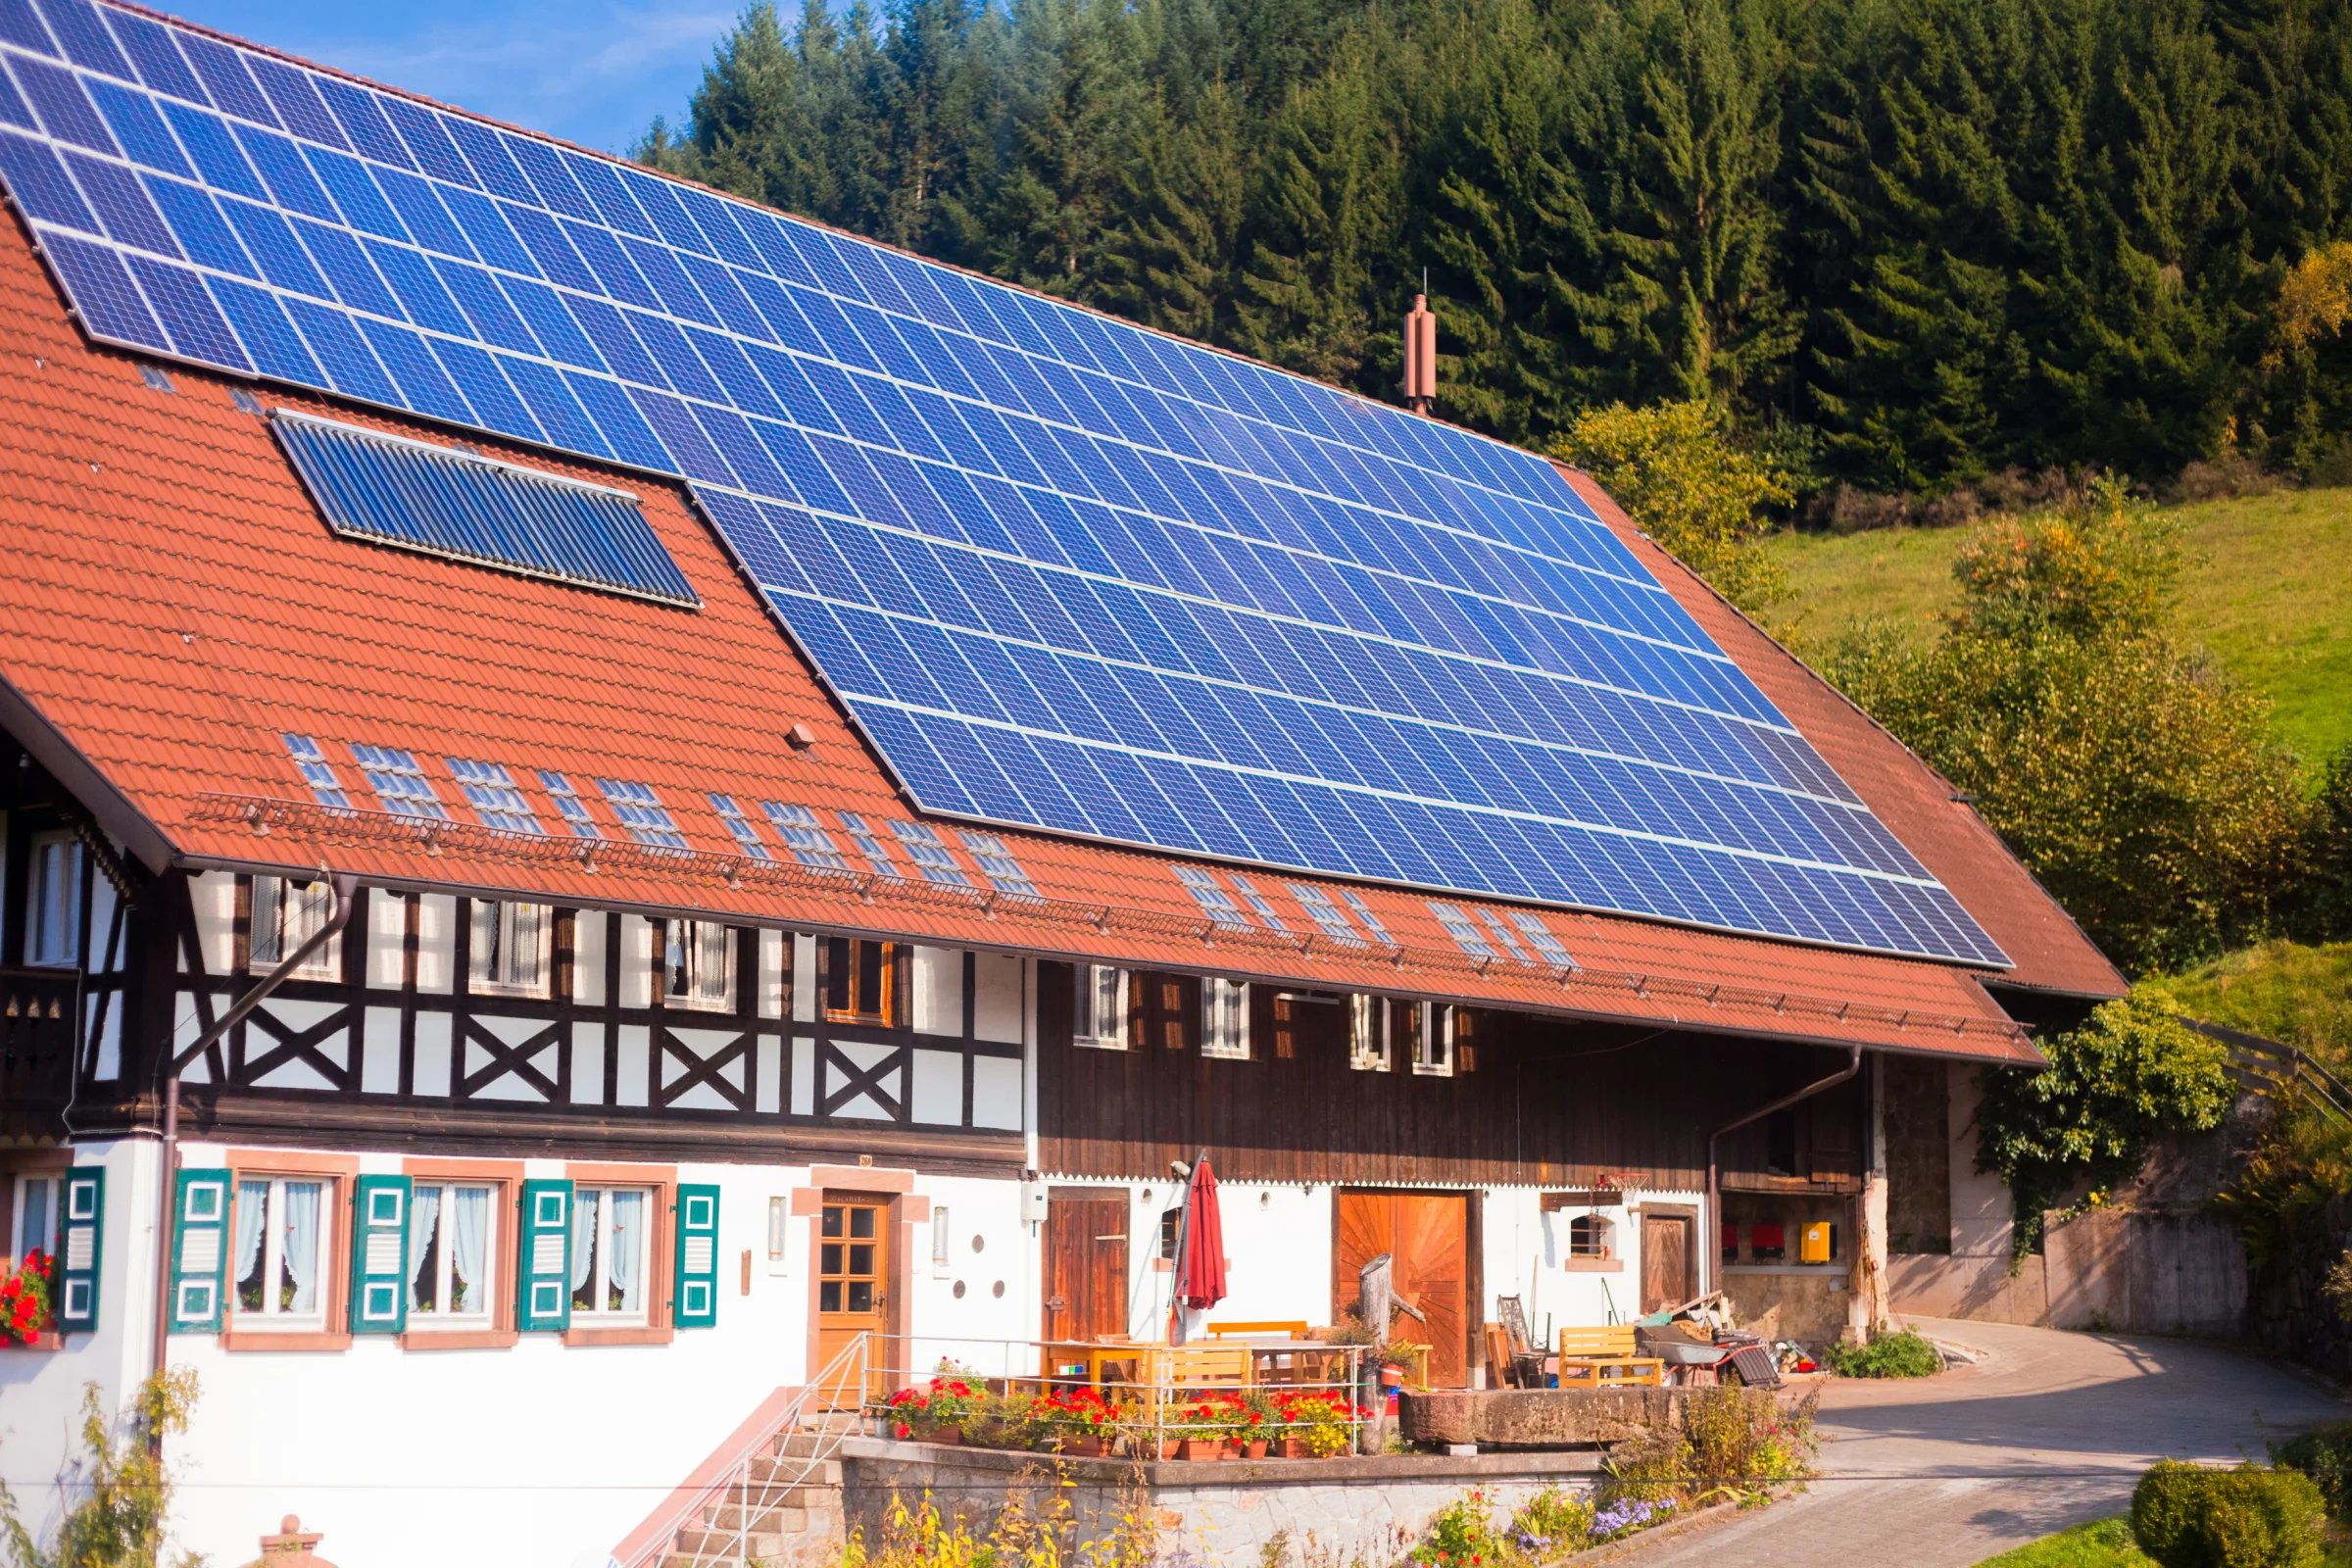
System Size
80 kWp
Completed
August 2026
What this is. A complete engineering and financial model for a representative 600 sqm neighbourhood supermarket, built from the equipment schedule upward. Every assumption is stated so you can substitute your own. What this is not. A client case study. The store modelled here is representative, not a specific business.
Quick Answer
The modelled store: 600 sqm neighbourhood supermarket, trading 08:00–21:00, seven days a week. Annual consumption: 295,723 kWh — about 24,300 kWh a month. Refrigeration alone accounts for 56% of it, running twenty-four hours a day. System specified: 80 kWp — and that is roof-constrained, not load-constrained. The consumption would justify 137 kWp; the roof only takes about 81. Bill reduction: 31%, not the 60–70% people expect. Two reasons: refrigeration runs all night when the array produces nothing, and the demand charge does not move at all. The demand charge is the part nobody explains. The store trades until 21:00, three hours after sunset. Peak demand therefore occurs in the evening, so the ₱359,661 a year in demand charges is completely untouched by solar. Payback is still 3.0 to 4.6 years. A 31% reduction on a very large bill is worth more than a 65% reduction on a small one.
Why supermarkets are different from every other commercial building
Most commercial solar content assumes a building that switches off at night. A supermarket does not, and that changes three things at once.
Refrigeration never stops. Chillers, freezers and cold rooms run continuously, and in Philippine ambient temperatures their compressors work hard. In our model, refrigeration alone is 56% of daily energy consumption — and roughly half of that is consumed after dark, where solar cannot reach it.
Trading hours extend past sunset. A store open until 21:00 is fully lit, fully cooled and fully refrigerated for three hours after the array has stopped producing. This is what breaks the demand charge case.
Roof area is small relative to consumption. A supermarket packs enormous electrical load into a modest footprint. Unlike a warehouse — vast roof, modest load — the supermarket runs out of roof long before it runs out of appetite for generation.
Step 1 — Load schedule
Built from the equipment actually installed, split by whether it runs continuously or only during trading.
Continuous, 24 hours
| Equipment | Load |
|---|---|
| Multideck display chillers, 4 × 1.20 kW | 4.80 kW |
| Glass-door freezers, 5 × 0.70 kW | 3.50 kW |
| Island freezers, 3 × 0.90 kW | 2.70 kW |
| Chiller cold room condensing unit | 3.50 kW |
| Freezer cold room condensing unit | 4.50 kW |
| Security and back-of-house lighting | 0.80 kW |
| CCTV and controls | 0.20 kW |
| Continuous subtotal | 20.00 kW |
Trading hours only, 13 hours
| Equipment | Load |
|---|---|
| Air conditioning, 10 × 3.0 HP inverter split | 17.00 kW |
| Sales floor lighting | 4.50 kW |
| POS and office equipment | 1.00 kW |
| Water pump | 0.40 kW |
| Bakery and deli equipment | 2.50 kW |
| Trading subtotal | 25.40 kW |
Peak demand: 20.00 + 25.40 = 45.40 kW
Figures for refrigeration are average draw, already accounting for compressor duty cycling.
Step 2 — Energy
| Component | Calculation | Energy |
|---|---|---|
| Continuous | 20.0 kW × 24 h | 480.0 kWh/day |
| Trading hours | 25.4 kW × 13 h | 330.2 kWh/day |
| Daily total | 810.2 kWh/day | |
| Monthly (30 days) | 24,306 kWh | |
| Annual | 295,723 kWh |
Sanity check. That works out to 493 kWh per square metre per year. Published benchmarks for supermarkets run roughly 400–700 kWh/sqm/year, so the model sits comfortably mid-range.
The number that matters: the continuous block is 480 of 810 kWh a day — 59% of consumption happens on a load that never switches off.
Step 3 — The roof is the constraint
This is where supermarkets diverge from almost every other commercial building.
| Step | Calculation | Result |
|---|---|---|
| Building footprint | 750 sqm | |
| Usable roof after setbacks, plant and access | 70% | 525 sqm |
| At 6.5 sqm per kWp | 525 ÷ 6.5 | 81 kWp maximum |
| Daytime share of consumption | 61.0% | |
| Capacity the load would justify | 295,723 × 0.61 ÷ 1,314 | 137 kWp |
The load justifies 137 kWp. The roof allows 81.
Specified system: 80 kWp.
For most residential and many commercial projects, the question is how much capacity the consumption justifies. For a supermarket it is usually how much capacity the roof will physically take. That reverses the design conversation — and it means a site survey matters more here than a bill analysis.
Production yield used throughout: 4.5 peak sun hours × 0.80 system efficiency × 365 = 1,314 kWh per kWp per year.
Step 4 — Production
| Annual production | 80 kWp × 1,314 = 105,120 kWh |
| Self-consumed (88%) | 92,506 kWh |
| Exported | 12,614 kWh |
| Production as a share of consumption | 35.5% |
| Consumption met directly by solar | 31.3% |
Self-consumption is high at 88% because the 20 kW continuous base load guarantees somewhere for the generation to go. Export only occurs in the middle hours of the brightest days, when output exceeds the store's draw.
Step 5 — The demand charge, and why solar does not touch it
Under Meralco's General Power tariff, a customer of this size pays on two axes.
Energy charges, per kWh (July 2026, VAT-exclusive):
| Component | Rate |
|---|---|
| Generation | ₱9.2504 /kWh |
| System loss | ₱0.8751 /kWh |
| Distribution (energy) | ₱0.1339 /kWh |
| AWAT refund | (₱0.1239) /kWh |
| Total energy-based | ₱10.1355 /kWh |
Demand charges, per kW of peak demand per month:
| Component | Rate |
|---|---|
| Transmission | ₱427.97 /kW |
| Distribution | ₱232.20 /kW |
| Total demand-based | ₱660.17 /kW/month |
At 45.4 kW of peak demand:
45.4 kW × ₱660.17 = ₱29,972 per month — ₱359,661 per year.
Now the critical question: when does that peak occur?
The store trades until 21:00. The array stops producing around 18:00. Between 18:00 and 21:00 the store is fully lit, fully air-conditioned and fully refrigerated, drawing its complete 45.4 kW with zero solar contribution.
The monthly peak demand therefore lands in the evening — and it is exactly the same after installing solar as before.
Demand charge saving from solar: ₱0.
This is the single most important thing for a retail owner to understand before signing, and it is almost never explained. Our commercial solar guide covers the general principle; a supermarket is the clearest example of it in practice.
Step 6 — The bill, before and after
VAT-exclusive, at July 2026 General Power Secondary rates.
| Before | After | |
|---|---|---|
| Energy charges | ₱2,997,300 | ₱2,059,710 |
| Export credit | — | (₱116,688) |
| Demand charges | ₱359,661 | ₱359,661 |
| Fixed supply and metering | ₱19,911 | ₱19,911 |
| Annual total | ₱3,376,872 | ₱2,322,593 |
| Monthly | ₱281,406 | ₱193,549 |
Annual saving: ₱1,054,279 — about ₱87,857 a month. Bill reduction: 31.2%
That 31% figure is the honest headline, and it is well below what most solar marketing implies. Two structural reasons: 59% of consumption is on a load that runs through the night, and the demand charge does not move.
Step 7 — Payback
Commercial installations achieve better cost per kWp than residential through scale.
| Installed cost per kWp | System cost | Payback |
|---|---|---|
| ₱40,000 | ₱3,200,000 | 3.0 years |
| ₱50,000 | ₱4,000,000 | 3.8 years |
| ₱60,000 | ₱4,800,000 | 4.6 years |
Here is the point that a 31% headline obscures: the payback is excellent anyway. A modest percentage of a very large bill is still over a million pesos a year. Percentage reduction is a poor way to judge commercial solar — the absolute saving against the capital cost is what matters.
Step 8 — Would a battery fix the demand charge?
The obvious question, and worth answering with numbers rather than instinct.
To shave the evening peak from 45.4 kW down to 25 kW, a battery would need to supply the difference across roughly three hours, 18:00 to 21:00 — approximately 136 kWh of usable capacity.
The saving would be real: 20.4 kW × ₱660.17 × 12 = ₱161,610 a year.
| Battery cost per kWh installed | System cost | Payback on demand charge alone |
|---|---|---|
| ₱20,000 | ₱2,724,000 | 17 years |
| ₱25,000 | ₱3,405,000 | 21 years |
| ₱30,000 | ₱4,086,000 | 25 years |
At current Philippine battery prices, storage does not pay for itself on demand-charge reduction alone. The economics change if you also value the backup — a supermarket losing refrigeration in an extended outage loses stock, and that calculation belongs on the same page as the demand charge, not on a separate one.
We would rather tell you this before you buy than after.
What would actually improve the result
Since solar cannot reach the evening peak, the peak is where the other savings are.
Refrigeration efficiency. It is 56% of consumption. Fitting doors to open multideck chillers, adding night blinds, upgrading to EC fan motors and improving door seals all reduce a load that runs continuously — including the hours solar cannot serve.
Demand management. If any deferrable load contributes to the evening peak — bakery equipment, water pumping, stock room work — shifting it into daylight hours reduces the billed demand directly, at no capital cost.
Load shifting into the array's window. Pre-cooling cold rooms during peak generation lets the thermal mass carry some of the evening, effectively using the stock as storage.
None of these are solar. All of them improve what solar delivers, and an installer who only talks about panels is leaving your money on the table.
Frequently asked questions
How much electricity does a supermarket use in the Philippines?
Our model for a 600 sqm neighbourhood supermarket gives approximately 810 kWh per day, or 295,723 kWh a year — about 493 kWh per square metre annually, which sits mid-range against published benchmarks of 400 to 700. Refrigeration accounts for roughly 56% of that, running continuously.
How much can solar save a supermarket?
In our model, an 80 kWp system reduces the annual bill by about 31%, saving roughly ₱1,054,000 a year. The reduction is lower than many buyers expect because most consumption is refrigeration running through the night, and because demand charges are unaffected. Payback is still 3.0 to 4.6 years depending on installed cost.
Why doesn't solar reduce my demand charge?
Demand charges are billed on your highest sustained draw during the month. A supermarket trading until 21:00 is fully lit, cooled and refrigerated for about three hours after solar output has stopped, so the monthly peak occurs in the evening and is unchanged by the array. At Meralco's General Power rates, transmission and distribution demand charges together come to ₱660.17 per kW per month.
What size solar system does a supermarket need?
For supermarkets the answer is usually set by roof area rather than consumption. In our model the load would justify 137 kWp, but the usable roof only accommodates about 81 kWp. This reverses the normal design conversation and makes a physical site survey more decisive than a bill analysis.
Is battery storage worth it for a supermarket?
Not on demand-charge reduction alone. Shaving the evening peak would require roughly 136 kWh of usable storage, saving about ₱161,600 a year — a payback of 17 to 25 years at current battery prices. Storage may still be justified if you also value protection against stock loss during outages, but that case should be made on the stock, not the tariff.
Model assumptions, in one place
| Assumption | Value |
|---|---|
| Sales floor area | 600 sqm |
| Building footprint | 750 sqm |
| Usable roof share | 70% |
| Roof area per kWp | 6.5 sqm |
| Trading hours | 13 (08:00–21:00), 7 days |
| Peak sun hours | 4.5 |
| System efficiency | 0.80 |
| Daytime share of consumption | 61.0% |
| Self-consumption share | 88% |
| Tariff | Meralco General Power Secondary, July 2026, VAT-exclusive |
| Installed cost | ₱40,000–60,000/kWp (shown as range) |
| Battery cost | ₱20,000–30,000/kWh (shown as range) |
Send SolarSwitch twelve months of bills including the demand (kW) figures, and we will run this model on your store rather than this one — including the parts where the answer is that solar is not the whole solution.