Commercial Solar
Solar for a Hotel or Resort: A Worked Example (2026)
August 17, 2026 · SolarSwitch · 9 min read
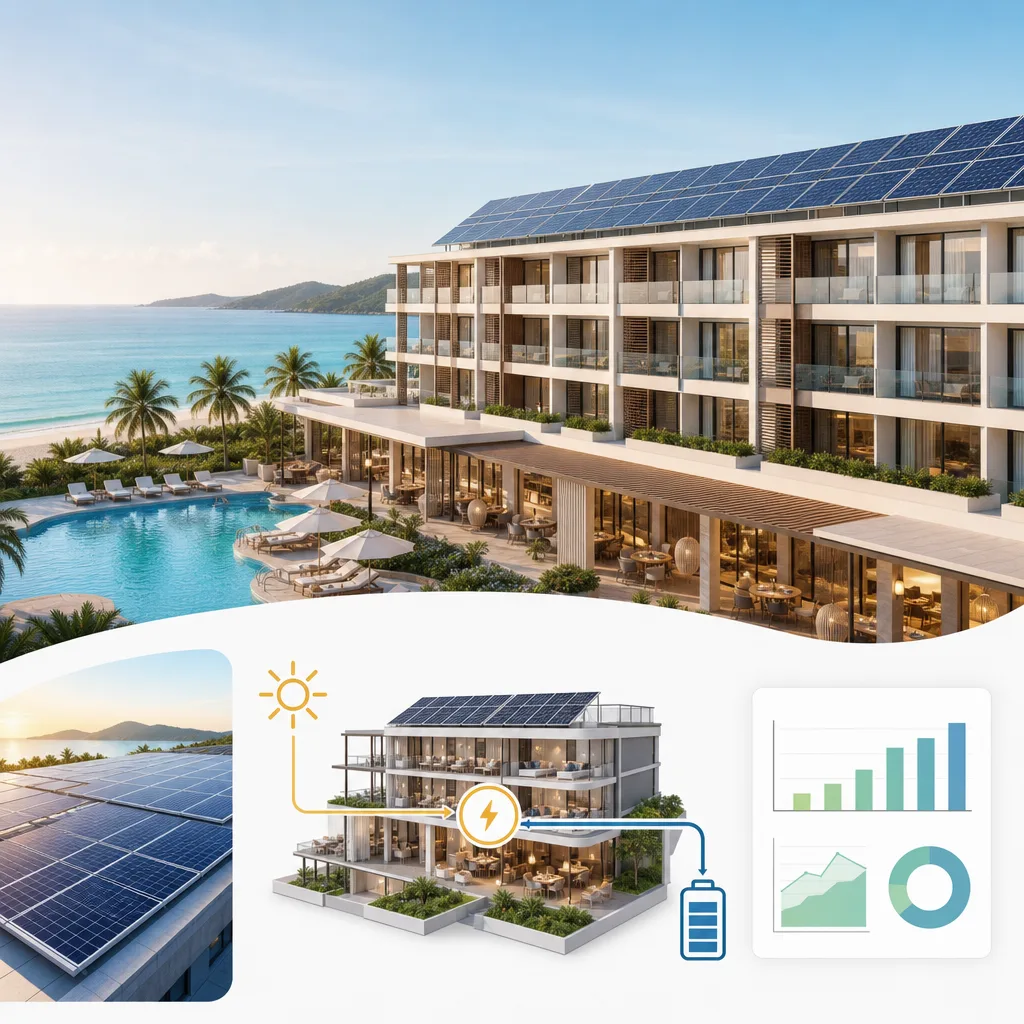
We modelled a 40-room resort hotel hour by hour. More than half its consumption falls inside the solar window — yet the demand charge is set at the shoulders, before sunrise and after sunset, and no amount of midday generation touches it.
What this is. A complete engineering and financial model for a representative 40-room resort hotel, built from the equipment schedule and run against an hour-by-hour generation profile. Every assumption is stated.
What this is not. A client case study. The property modelled here is representative, not a specific hotel.
Quick Answer
The modelled property: 40-room resort hotel, 70% annual occupancy, restaurant, pool, on-site laundry. Annual consumption: 367,701 kWh — about 30,600 kWh a month, or 36 kWh per occupied room-night. 53.3% of consumption falls inside the solar window, the highest share of any commercial sector we have modelled. Laundry, pool filtration, kitchen prep, housekeeping and common-area cooling are all daytime loads. System specified: 120 kWp — deliberately smaller than the daytime load would suggest, because sizing to match daytime demand exports a fifth of the output at the lower generation rate. Bill reduction: 38.6%, saving roughly ₱1,585,000 a year. Payback 3.0 to 4.5 years. The finding that matters: the demand charge is set at 06:00 and 18:00 — the shoulders, when the hotel is at full load and the array produces nothing. Between 10:00 and 14:00 solar reduces net grid demand to zero. It changes the demand charge by 1 kW.
Why hotels are structurally different
A supermarket has a flat, refrigeration-dominated load. A poultry house has a load that tracks temperature. A hotel has neither — it has three distinct operating states in every twenty-four hours, and they do not overlap neatly with daylight.
Daytime is back-of-house: laundry running, pool filtering, kitchen prepping, housekeeping working, and lobby and restaurant cooling for a building that is mostly empty of guests.
Evening is front-of-house: guests return, room aircon comes on, dinner service runs, the restaurant fills, and hot water demand spikes.
Night is quiet but not idle: forty rooms of air conditioning running through the night is a substantial and unavoidable load.
That structure produces the model's central result, which we will come to.
Step 1 — Load schedule
Continuous, 24 hours
| Equipment | Load |
|---|---|
| Kitchen refrigeration (walk-ins, reach-ins) | 8.00 kW |
| Minibar fridges, 40 × 40 W | 1.60 kW |
| Corridor, common and emergency lighting | 2.50 kW |
| Water pumps (booster, transfer) | 1.50 kW |
| Controls, CCTV, IT | 0.80 kW |
| Continuous subtotal | 14.40 kW |
Day block, 06:00–18:00 — additional
| Equipment | Load |
|---|---|
| Laundry (8 hours, averaged across block) | 8.00 kW |
| Lobby and restaurant aircon | 8.05 kW |
| Guest aircon, rooms occupied but vacant (30%) | 5.04 kW |
| Kitchen equipment, breakfast and lunch | 3.00 kW |
| Lobby and restaurant lighting | 3.00 kW |
| Pool pump and filtration | 1.47 kW |
| Housekeeping and office | 1.00 kW |
| Water heating, morning recovery | 0.75 kW |
| Day additional | 30.31 kW → total 44.71 kW |
Evening block, 18:00–22:00 — additional
| Equipment | Load |
|---|---|
| Guest room aircon (70% of occupied rooms) | 11.76 kW |
| Kitchen equipment, dinner service | 7.00 kW |
| Restaurant aircon | 4.60 kW |
| Restaurant and lobby lighting | 3.00 kW |
| Water heating, evening recovery | 2.50 kW |
| Guest room lighting and TV | 1.96 kW |
| Pool lighting and water feature | 0.50 kW |
| Evening additional | 31.32 kW → total 45.72 kW |
Night block, 22:00–06:00 — additional
| Equipment | Load |
|---|---|
| Guest room aircon, occupied rooms sleeping | 16.80 kW |
| Guest room lighting and TV | 2.80 kW |
| Water heating, overnight recovery | 2.00 kW |
| Night additional | 21.60 kW → total 36.00 kW |
Note the margin. Day 44.71 kW · Evening 45.72 kW · Night 36.00 kW. The day and evening blocks are 1.01 kW apart. Hold that thought.
Step 2 — Energy
| Block | Load | Hours | Energy | Share |
|---|---|---|---|---|
| Day 06:00–18:00 | 44.71 kW | 12 | 536.5 kWh | 53.3% |
| Evening 18:00–22:00 | 45.72 kW | 4 | 182.9 kWh | 18.2% |
| Night 22:00–06:00 | 36.00 kW | 8 | 288.0 kWh | 28.6% |
| Daily total | 1,007.4 kWh | |||
| Annual | 367,701 kWh |
Sanity check: 36.0 kWh per occupied room-night, against published hotel benchmarks of roughly 20–40. Mid-range, as expected for a property with a restaurant, pool and on-site laundry.
53.3% inside the solar window is the highest daytime share of any sector we have modelled — better than a supermarket's 61% of a much flatter load, and better than poultry's 58%. Hotels are genuinely good solar candidates, and this is why.
Step 3 — Sizing, done properly
Here we depart from the shortcut most sizing calculations use — including our own earlier worked examples.
The simple method takes daytime consumption and divides by annual yield. For this hotel: 195,830 kWh ÷ 1,314 kWh/kWp = 149 kWp.
That answer is wrong, and the reason is the shape of the generation curve. Solar does not deliver a flat block of power across twelve hours — it follows a bell, near zero at the edges and peaking at noon. Against a day-block load held at 44.71 kW, a large array overshoots badly in the middle hours and exports the surplus at the lower generation-only credit.
Modelling generation as a half-sine across the window and comparing hour by hour against the load:
| System | Peak output | Self-consumed | Exported | Self-consumption | Annual production |
|---|---|---|---|---|---|
| 80 kWp | 37.7 kW | 288.0 kWh/day | 0.0 | 100.0% | 105,120 kWh |
| 100 kWp | 47.1 kW | 356.1 | 3.9 | 98.9% | 131,400 kWh |
| 110 kWp | 51.8 kW | 376.8 | 19.2 | 95.2% | 144,540 kWh |
| 120 kWp | 56.5 kW | 392.6 | 39.4 | 90.9% | 157,680 kWh |
| 140 kWp | 66.0 kW | 415.6 | 88.4 | 82.5% | 183,960 kWh |
| 149 kWp | 70.2 kW | 423.5 | 112.9 | 79.0% | 195,786 kWh |
The "match the daytime load" answer of 149 kWp exports 21% of its output at roughly two-thirds the value of self-consumed energy. Additional capacity beyond about 120 kWp buys progressively less.
Specified: 120 kWp, at 90.9% self-consumption.
This table is the single most useful output of the model. The right system size is where the self-consumption curve starts bending — not where the annual totals happen to match.
Step 4 — Production
| Annual production | 157,680 kWh |
| Self-consumed (90.9%) | 143,285 kWh |
| Exported | 14,395 kWh |
| Production as a share of consumption | 42.9% |
| Consumption met directly by solar | 39.0% |
Step 5 — The demand charge is set at the shoulders
This is the finding worth the whole exercise.
Net grid demand, hour by hour, with the 120 kWp array running:
| Hour | Load | Solar | Net grid demand |
|---|---|---|---|
| 00:00–05:00 | 36.00 kW | 0 | 36.00 kW |
| 06:00 | 44.71 kW | 0 | 44.71 kW |
| 07:00 | 44.71 kW | 14.64 | 30.07 kW |
| 08:00 | 44.71 kW | 28.27 | 16.44 kW |
| 09:00 | 44.71 kW | 39.99 | 4.72 kW |
| 10:00–14:00 | 44.71 kW | 48.97–56.55 | 0.00 kW |
| 15:00 | 44.71 kW | 39.99 | 4.72 kW |
| 16:00 | 44.71 kW | 28.27 | 16.44 kW |
| 17:00 | 44.71 kW | 14.64 | 30.07 kW |
| 18:00–21:00 | 45.72 kW | 0 | 45.72 kW ← peak |
| 22:00–23:00 | 36.00 kW | 0 | 36.00 kW |
For five hours in the middle of the day, solar reduces net grid demand to zero. The hotel draws nothing at all from the utility.
And it changes the demand charge by nothing, because the billed peak occurs at 18:00 — and the second-highest point is 06:00, an hour before the array produces anything meaningful.
The demand charge is set at the shoulders. Solar works in the middle.
At Meralco General Power rates, that peak costs 45.72 kW × ₱660.17 = ₱362,196 a year, unchanged by the installation.
The 1 kW margin
Recall that the day and evening blocks sit 1.01 kW apart. The evening block contains about 3.0 kW of genuinely shiftable load — water heating recovery and pool lighting.
Shift that, and the evening block drops to 42.72 kW, below the day block. But the billed peak then becomes 44.71 kW at 06:00 — the morning shoulder.
The saving is real but small: 1.01 kW × ₱660.17 × 12 = ₱8,001 a year.
That is the honest answer, and it is worth publishing precisely because it is unimpressive. The morning shoulder is a hard floor. Getting below it would mean attacking guest-room air conditioning or kitchen operations at 06:00, which is an operations decision, not an energy one.
Step 6 — The bill
Meralco General Power Secondary, July 2026, VAT-exclusive.
| Before | After | |
|---|---|---|
| Energy charges (₱10.1355/kWh) | ₱3,726,833 | ₱2,274,447 |
| Export credit | — | (₱133,155) |
| Demand charges | ₱362,196 | ₱362,196 |
| Fixed supply and metering | ₱19,911 | ₱19,911 |
| Annual total | ₱4,108,940 | ₱2,523,515 |
| Monthly | ₱342,412 | ₱210,293 |
Annual saving: ₱1,585,425 — about ₱132,100 a month. Bill reduction: 38.6%
Step 7 — Payback
| Installed cost per kWp | System cost | Payback |
|---|---|---|
| ₱40,000 | ₱4,800,000 | 3.0 years |
| ₱50,000 | ₱6,000,000 | 3.8 years |
| ₱60,000 | ₱7,200,000 | 4.5 years |
Step 8 — The seasonal hedge
Something hotels get for free that most sectors do not.
Philippine resort occupancy is highest in the dry months, November through May — which is exactly when irradiance is highest. Occupancy falls during habagat, June to October, and so does production.
| Season | Occupancy | Peak sun hours | Generation |
|---|---|---|---|
| Dry / high season (Nov–May) | ~85% | ~5.0 | ~480 kWh/day |
| Habagat / low season (Jun–Oct) | ~55% | ~3.8 | ~365 kWh/day |
Consumption and generation rise and fall together. In high season, when the hotel is full and consuming most, the array produces most. In low season both drop.
This matters for two reasons. Self-consumption stays high year-round rather than collapsing in one season, and the saving is largest in the months when the property has the most revenue to protect. Very few commercial load profiles are naturally hedged this way — a school, for instance, is the exact opposite, generating hardest when the buildings are empty.
What would actually reduce the demand charge
Since solar cannot reach the shoulders, that is where the remaining money is.
Heat pump water heating with a larger storage tank. A hot water tank is thermal storage you already own. Heating during peak generation and holding it removes water heating from both shoulders entirely.
Stagger the morning start. Laundry, pool filtration and kitchen prep starting at 06:00 together create the morning shoulder. Sequencing them across 06:00 to 09:00 — as generation ramps — flattens it without buying anything.
Guest room aircon setback. Room controls that raise the setpoint in unoccupied rooms cut both the evening block and the night block, which is the largest single load in the model.
Kitchen scheduling. Dinner service is 7.00 kW in the evening block. Prep work moved into daylight hours reduces the peak that sets the bill.
None of these are solar. All of them improve what solar delivers.
Frequently asked questions
How much electricity does a hotel use in the Philippines?
Our model for a 40-room resort at 70% occupancy gives approximately 1,007 kWh per day, or 367,701 kWh a year — about 36 kWh per occupied room-night, which sits mid-range against published benchmarks of 20 to 40. Properties with restaurants, pools and on-site laundry sit at the higher end.
How much can solar save a hotel?
In our model a 120 kWp system reduces the annual bill by 38.6%, saving roughly ₱1,585,000 a year with payback between 3.0 and 4.5 years. Hotels perform well because 53% of consumption falls inside the solar window — laundry, pool filtration, kitchen prep and common-area cooling are all daytime loads.
What size solar system does a hotel need?
Size to the self-consumption curve rather than to daytime consumption. In our model, matching daytime consumption suggests 149 kWp, but that exports 21% of output at the lower generation-only credit. The better answer is around 120 kWp at 90.9% self-consumption, where additional capacity begins returning noticeably less.
Will solar reduce my hotel's demand charge?
Very little. Our hour-by-hour model shows the billed peak occurring at 18:00, with the second-highest point at 06:00 — both outside meaningful generation. Solar reduces net grid demand to zero between 10:00 and 14:00 but changes the billed peak by about 1 kW. Reducing demand charges at a hotel is an operations question: staggering morning start-up, shifting water heating, and setting back unoccupied room air conditioning.
Is solar better for hotels in high season or low season?
Both, and that is the advantage. Philippine occupancy peaks during the dry months when irradiance is also highest, and falls during habagat when production falls too. Consumption and generation move together, which keeps self-consumption high year-round and delivers the largest savings in the months of highest revenue.
Model assumptions
| Assumption | Value |
|---|---|
| Rooms | 40 |
| Annual occupancy | 70% |
| Operating blocks | Day 06–18 · Evening 18–22 · Night 22–06 |
| Peak sun hours | 4.5 annual average |
| System efficiency | 0.80 |
| Generation profile | Half-sine across the 06:00–18:00 window |
| Self-consumption | Computed hour by hour, not assumed |
| Tariff | Meralco General Power Secondary, July 2026, VAT-exclusive |
| Installed cost | ₱40,000–60,000/kWp (range) |
Send SolarSwitch twelve months of bills including demand (kW) figures, plus your occupancy pattern, and we will run this model on your property — including the parts where the answer is scheduling rather than panels.